I published a blog on the rise and rise of the Gene Ontology. This described my Ph.D. student Geraint Duck’s work on bioNerDS, a named entity recogniser for bioinformatics databases and software. In a survey of Genome Biology and BMC Bioinformatics full text articles we saw that the Gene Ontology is in the top ten of mentioned resources (a fact reflected in our survey of the whole of 2013’s PMC). This interesting survey was, however, a bit of a side-show to our goal of trying to extract descriptions of bioinformatics and computational biology method from text. Geraint has just presented a paper at ECCB 2014 called:
Geraint Duck, Goran Nenadic, Andy Brass, David L. Robertson, and Robert Stevens. Extracting patterns of database and software usage from the bioinformatics literature. Bioinformatics, 30(17):i601-i608, 2014.
That has edged towards our ultimate goal of extracting bioinformatics and computational method from text. Ideally this would be in a form that people wishing to use bioinformatics tools and data to analyse their data could consult a resource of methods and see what was commonly done, how and with what it was done, what’s the latest method for data, who’s done each method and so on and so on.
Geraint’s paper presents some networks of interacting bioinformatics software and databases that shows patterns of commonly occurring pairs of resources appearing in 22,418 papers from the 2013 PMC corpus that had the MeSH term “Bioinformatics” as a tag. When assembled into a network, there are things that look remarkably like methods, though they are not methods that necessarily appear in any one individual paper. What Geraint did in the ECCB paper was:
- Take the results of his bioNerDS survey of the articles in PMC 2013 labelled with the MeSH term “Bioinformatics”.
- Removed all resources that were only mentioned once (as they probably don’t really reflect “common” method).
- Filter the papers down to method sections.
- Get all the pairs of adjacent resources.
- Assuming the most used ordering (“Software A takes data from Database B” or “Data from Database B is put into Software A”), we used a binomial test to find the dominant ordering and assumed that was the correct ordering (our manually sampled and tested pairs suggests this is the case).
- Resources were labelled as to whether they are software or a database. A network is constructed by joining the remaining pairs together.
The paper gives the details of our method for constructing patterns of usage and describes the evaluations of each part of the method’s outputs.
Some pictures taken from the paper of these networks created from assembling these ordered pairs of bioinformatics resources are:
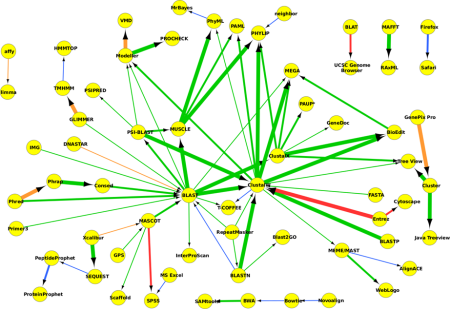
Figure 1 A network formed from the software recovered by bioNerDS at the 95% confidence level
This shows the network with only bioinformatics software. In Figure 1 we can see a central set of sequence alignment tools, split into homologue search, multiple sequence alignment and pairwise sequence alignment tools), which reflects the status of these core, basic techniques in bioinformatics based analyses. Feeding into this are sequence assembly, gene locator and mass spectroscopy tools. Out of the sequence analysis tools come proteomic tools, phylogeny tools and then some manual alignment tools. Together these look like a pipeline of core bioinformatics tasks, orientated around what we may call “bioinformatics 101” – it’s the core, vital tasks that many biologists and bioinformaticians undertake to analyse their data.
The next picture shows a network created from both bioinformatics software and databases. Putting in both software and databases in Figure 2, we can see what the datasets are “doing” in the pipelines above: UniProt and GEO are putting things into BLAST; GenBank links into multiple sequence alignment tools; PDB links into various sequence prediction and evaluation tools.

Figure 2 A network formed from the bioinformatics and database recovered by bioNerDS at the 95% confidence level
Finally, we have the same network of bioinformatics software and databases, but with the Gene Ontology node (which we count as a database) highlighted.

Figure 3 The same network of bioinformatics software and databases, but with the Gene Ontology and its associates highlighted.
In another blog I spoke about the significance of the Gene Ontology, as recorded by bioNerDS, and this work also highlights this point. In this network we’re seeing GO as a “data sink”, it’s where data goes, not where it comes from – presumably as it is playing its role in annotation tasks. However, its role in annotation tasks, as well as a way of retrieving data, fits sensibly with what we’ve seen in this work. It may well be that we need a more detailed analysis of the language to pick up and distinguish where GO is used as a means of getting a selection of sequences one wants for an analysis – or to find out if people do report this activity. Again we see GO with a central role in bioinformatics – a sort of confirmation of its appearance in the top flight of bioinformatics resource mentions in the whole PMC corpus.
What are we seeing here? We are not extracting methods from the text (and certainly not individual methods from individual papers). What we’ve extracted are patterns of usage as generalised over a corpus of text. What we can see, however, are things that look remarkably like bioinformatics and computational biology method. In particular, we see what we might call “bioinformatics 101” coming through very strongly. It’s the central dogma of bioinformatics… protein or nucleic acid sequences are taken from a database and then aligned. Geraint’s paper also looks at patterns over time – and we can see change. Assuming that this corpus of papers from PMC is a proxy for biology and bioinformatics as a whole and that, despite the well-known inadequacy of method reporting, the methods are a reasonable proxy for what is actually done, BioNerDS is offering a tool for looking at resources and their patterns of usage.